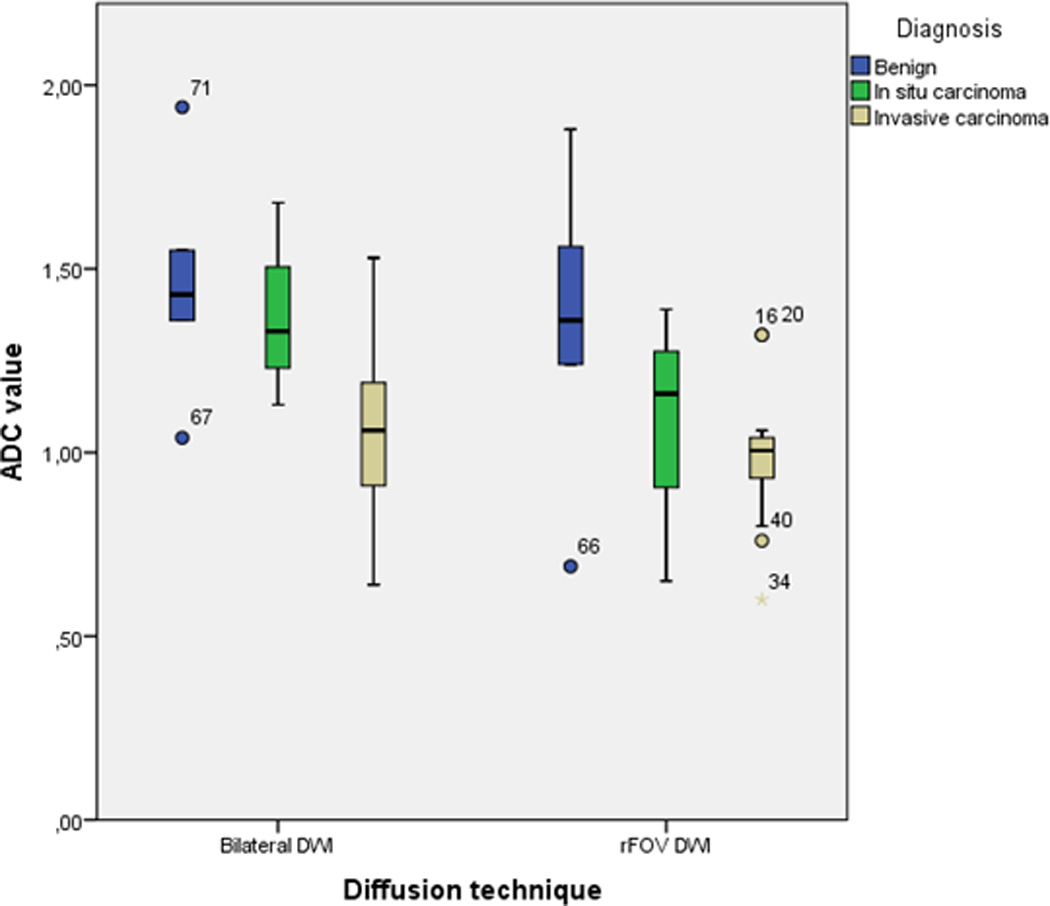
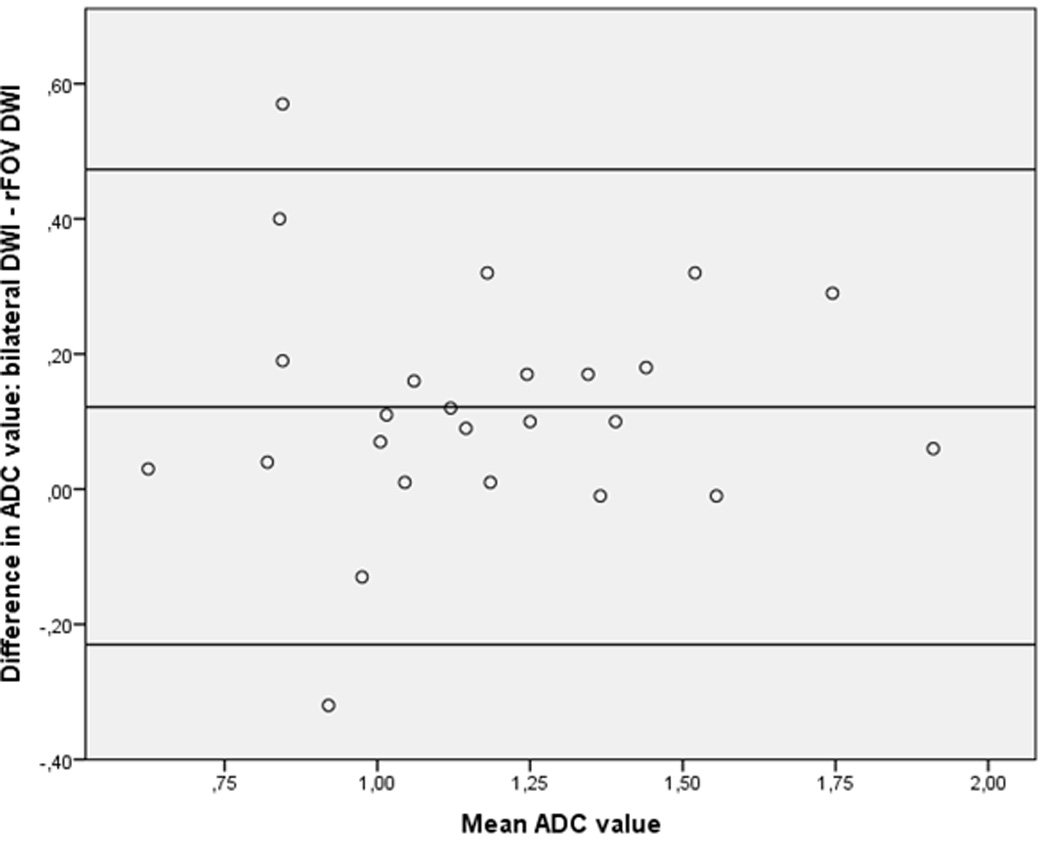
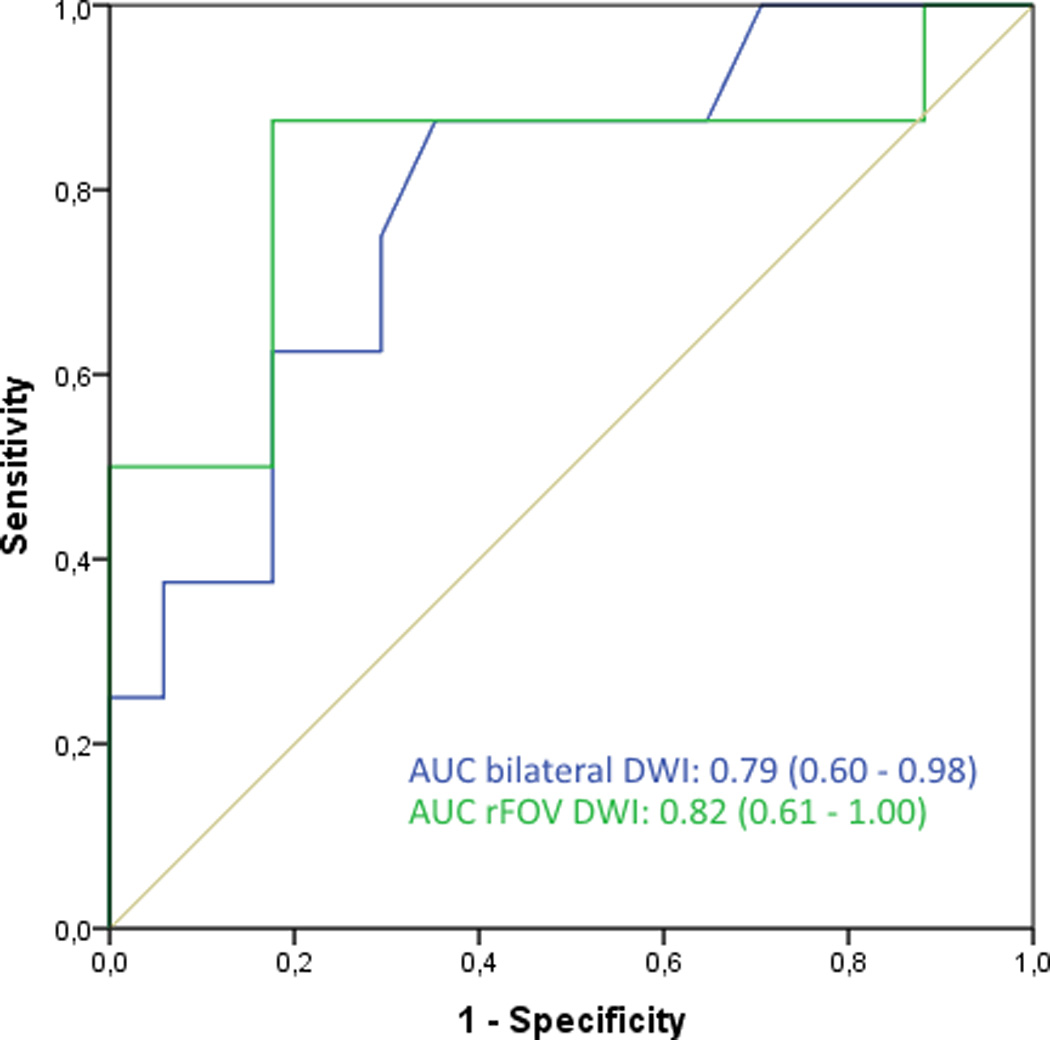
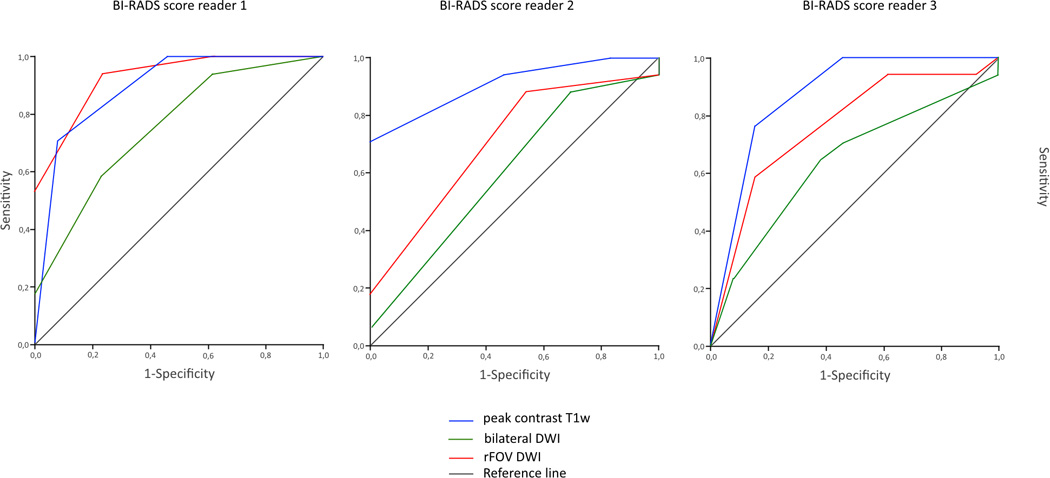
Figure 2.


a. Boxplot showing the ADC values, comparing bilateral DWI and rFOV DWI categorized by diagnosis.
b. Bland Altman plot showing difference in ADC value (bilateral DWI – rFOV DWI) versus mean ADC value
c. ROC curves, showing the discriminative abilities of bilateral and rFOV DWI based on ADC values
d. ROC curves, showing the discriminative abilities of the readers based on BI-RADS classification on peak contrast T1w images, bilateral DWI, and rFOV DWI
| Reader 1: | peak contrast T1w | : 0.89 (0.77–1.00) |
| bilateral DWI | : 0.76 (0.58–0.93) | |
| rFOV DWI | : 0.93 (0.84–1.00) | |
| Reader 2: | peak contrast T1w | : 0.91 (0.80–1.00) |
| bilateral DWI | : 0.61 (0.40–0.81) | |
| rFOV DWI | : 0.71 (0.52–0.90) | |
| Reader 3: | peak contrast T1w | : 0.87 (0.73–1.00) |
| bilateral DWI | : 0.64 (0.44–0.84) | |
| rFOV DWI | : 0.76 (0.59–0.94) |
