
Fig. 4.
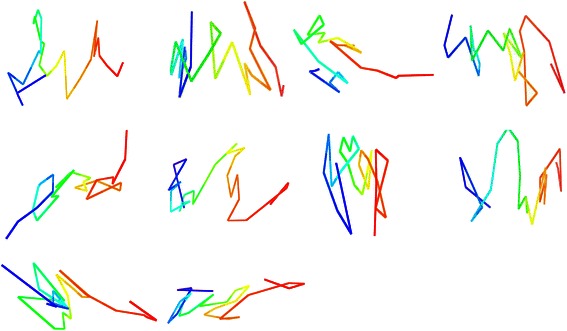
Visualization of successive iterations of adaptation step. Ten visualized models of chromosome 21 resembling different successive iterations of the adaptation step. Visualization is shown, from left to right and top to bottom, for every 5000 iterations to demonstrate the effect on the model the adaptation step has