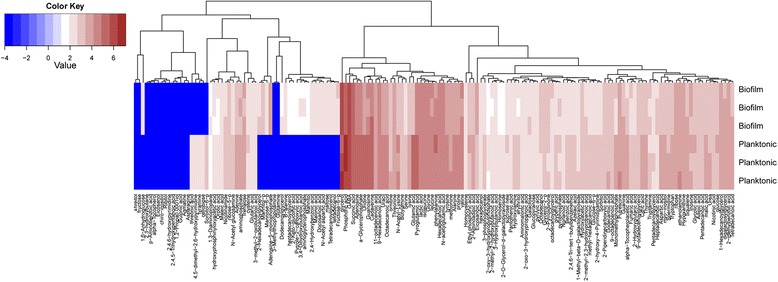
Fig. 3.

Heat map indicating the metabolomic profile of biofilm and planktonic ETJB1H Vibrio fischeri strains. Data are shown in triplicate as a colored map reflecting the logarithms that relate to the metabolite changes (red areas indicate an increase in metabolite abundancy, blue areas depict a decrease). Log values are color coded as indicated in the scale
