Fig. 1.

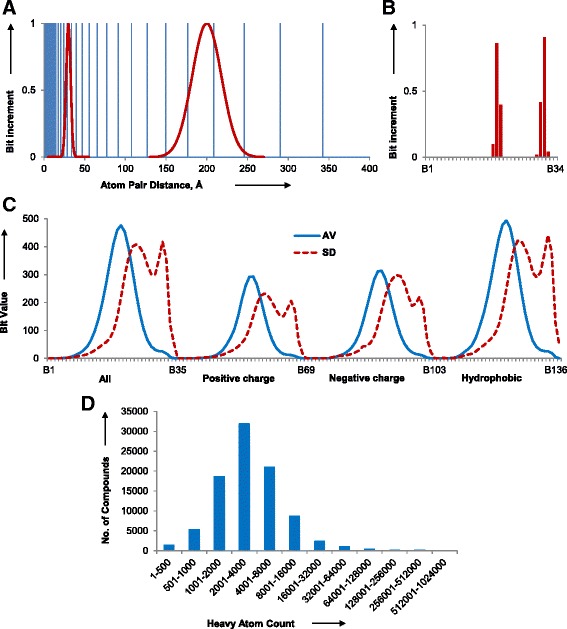
3DP fingerprint design. a 34 sampling values between 1.45 and 400 Å (blue vertical bars) and example Gaussian corresponding to two atom pair distances (red line). b Sampling of bit values of B1–B34 for the atom pairs at 30 and 200 Å from the Gaussian functions in a. c Average (AV, blue continuous line) and standard deviation (SD, red doted line) of bit values of 3DP for all biological assemblies in the PDB. d Distribution of heavy atom count (HAC) values in the PDB. The analysis is based on 91,223 X-ray structures downloaded from the PDB in September 2014, considering in each case the biological assembly as defined by the authors
