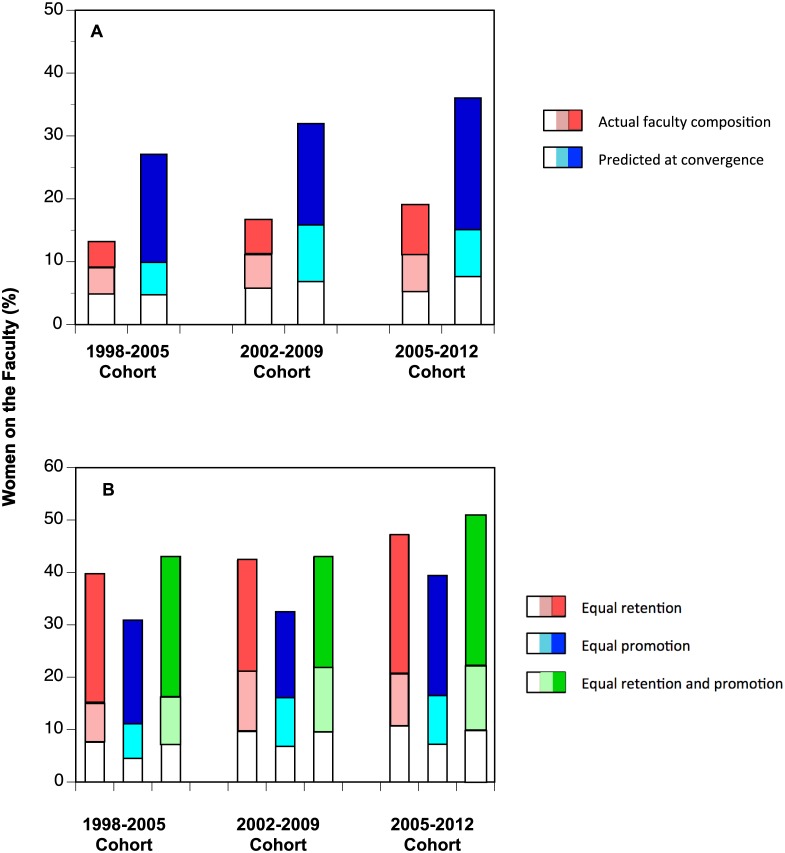
Fig 4. Results of simulations.
For all bars, the bottom (white) segment represents Assistant Professors, with Associate Professors above them and Professors as the top segment. A) Actual representation of women on the faculty (red) and convergent state (blue), given the respective transition matrix. B) Simulated convergence states under the assumption that recruitment of Assistant Professors is 50% women (red); 2) retention of male and female Assistant Professors is equal (blue); or 3) both recruitment and retention of Assistant Professors is equal (green).

