
Fig. 1.
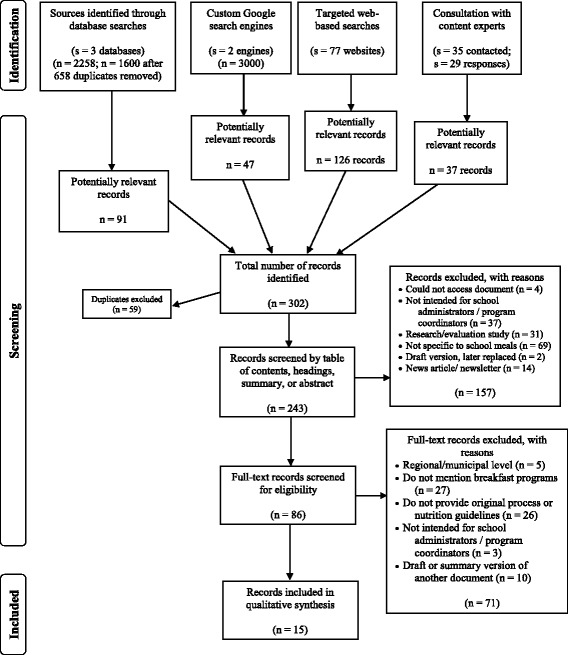
Study flow diagram. This figure depicts the three phases of the review, including the number of records screened and included in the final synthesis
Official websites use .gov
A
.gov website belongs to an official
government organization in the United States.
Secure .gov websites use HTTPS
A lock (
) or https:// means you've safely
connected to the .gov website. Share sensitive
information only on official, secure websites.
Study flow diagram. This figure depicts the three phases of the review, including the number of records screened and included in the final synthesis