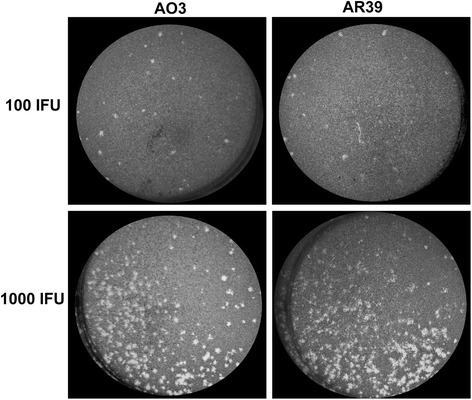
Fig. 2.

Comparison of plaques formed by C. pneumoniae strains AO3 and AR39. Shown are representative images of individual plaques formed following infection of L929 fibroblasts with the indicated inoculum, using the plaque assay described in the Methods section. Plaque sizes were determined to be 0.736 ± 0.033 mm for AO3 and 0.664 ± 0.035 mm for AR39 (mean ± SEM, n = 25; no significant difference). Data is representative of 3 independent experiments
