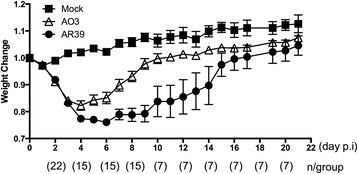
Fig. 4.

Kinetics of weight loss in mice infected with C. pneumoniae strains AO3 or AR39. C57BL/6 mice were intranasally infected with C. pneumoniae strain AO3 or AR39, or mock infected, as described in the Methods. After infection, mice were monitored and weighed daily. At predetermined time points, a subset of the mice were euthanized for analysis of histopathological changes and bacterial culture. Percent body weight was calculated compared to body weight at the time of inoculation, and is graphed on the y-axis. The number mice per group are indicated in parentheses below the x-axis. Statistical analysis was carried out as described in the Methods section. Significance: p < 0.05 for overall effect of condition on days 2-9 and borderline (p = 0.05-0.1) on days 10 and 11, as determined by ANOVA F-test (adjusted p-value). Within this significant F-test period, p < 0.05 days 6-9 and borderline (p = 0.05-0.1) on day 5 for AO3 vs. AR39. Data is representative of 2 independent experiments
