Fig. 1.

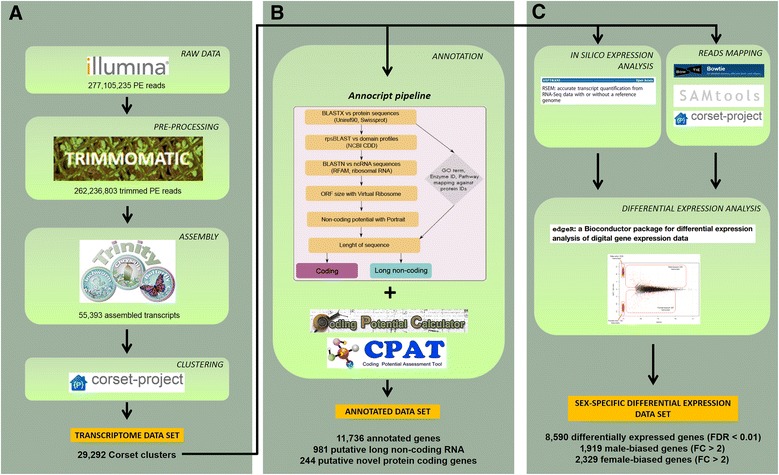
Analysis workflow. Flowchart illustrating the main steps of the bioinformatics pipeline: a assembly, (b) annotation and (c) differential expression analysis. FDR = false discovery rate, FC = fold change

Analysis workflow. Flowchart illustrating the main steps of the bioinformatics pipeline: a assembly, (b) annotation and (c) differential expression analysis. FDR = false discovery rate, FC = fold change