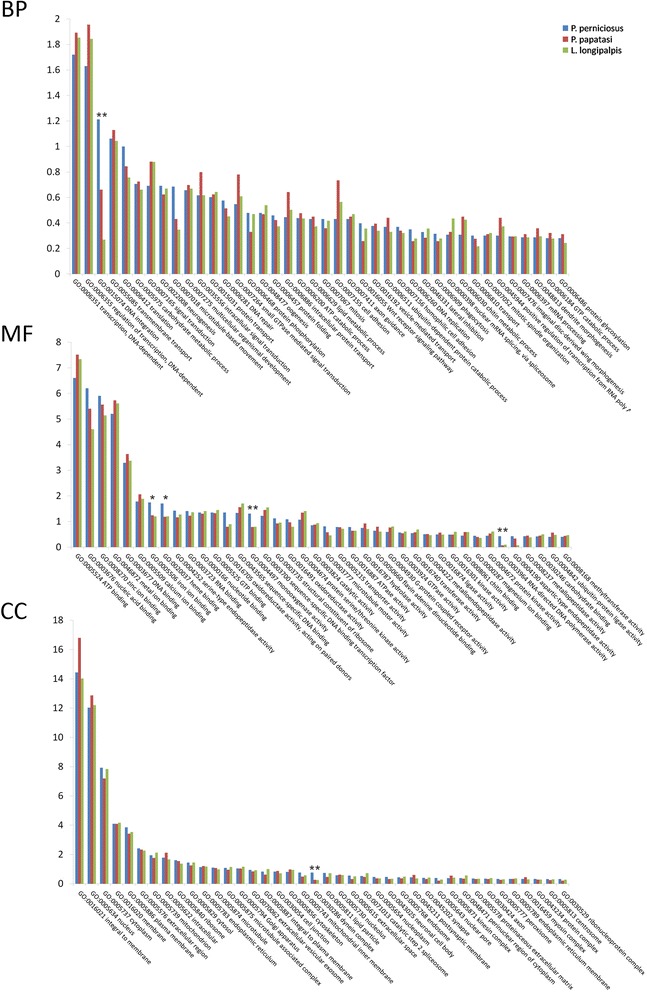
Fig. 3.

GO term distribution of the annotated transcripts of the PERNI data set compared with those of P. papatasi and L. longipalpis. GO categories are shown within the divisions of Biological Process (BP), Molecular Function (MF), and Cellular Component (CC). Column heights reflect the percentage of annotated transcripts in each assembly that mapped to a given GO term. Asterisks indicate the statistical significance of the differences observed in the pair-wise comparison between P. perniciosus and P. papatasi and between P. perniciosus and L. longipalpis (* = P < 0.05. ** = P < 0.01)
