
Fig. 1.
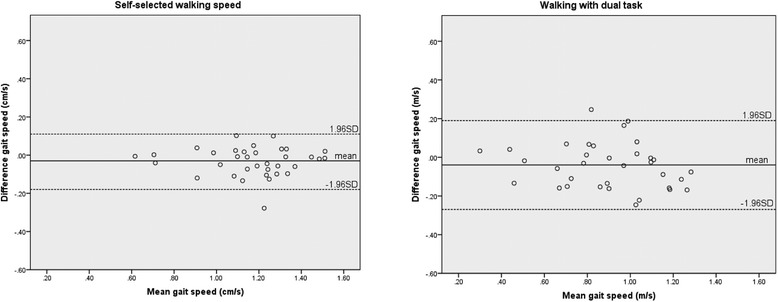
Bland-Altman plots for self-selected walking speed (left) and walking with dual task (right). Difference in individual self-selected gait speed between the test re-test sessions, plotted against the individual mean gait speed of the two sessions (m/s). The plot on the left side demonstrates self-selected walking, the plot on the right side self-selected walking speed with performance of a concurrent cognitive dual task. The mid line shows the mean difference (-0.03 m/s left and -0.04 m/s right), dashed lines show the upper and lower limits of (95 %) agreement (-0.18 and 0.11 m/s left and -0.27 and 0.19 m/s right)