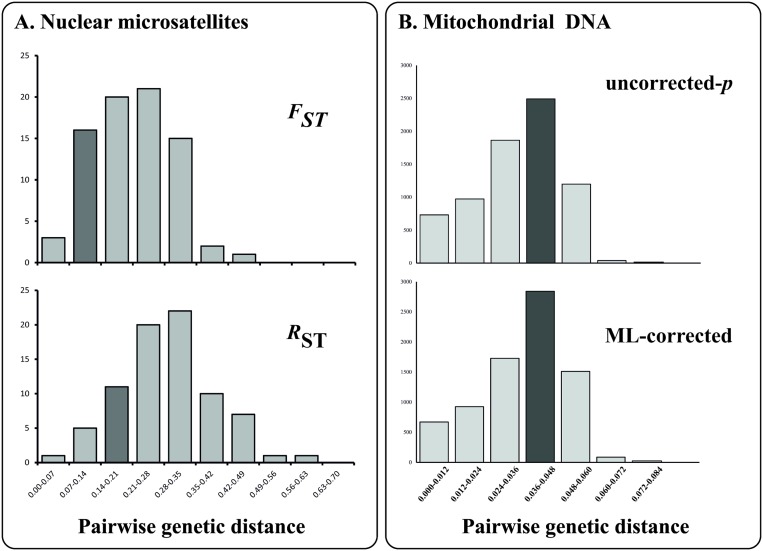
Fig 5. Frequency distribution of genetic distances between different Galapagos giant tortoise species (A: microsatellite DNA, B: mitochondrial DNA).
For each histogram, a dark gray column indicates where the observed genetic distance between the Cerro Fatal and Reserva tortoises falls. Left: Microsatellite genetic distances calculated from purebred individuals in the reference measured using F ST (top) or R ST (below). Right: DNA sequence genetic distances based on mtDNA haplotypes from purebred individuals in the reference database, measured using uncorrected p-distances (top), or maximum likelihood (ML)-corrected distances (below).

