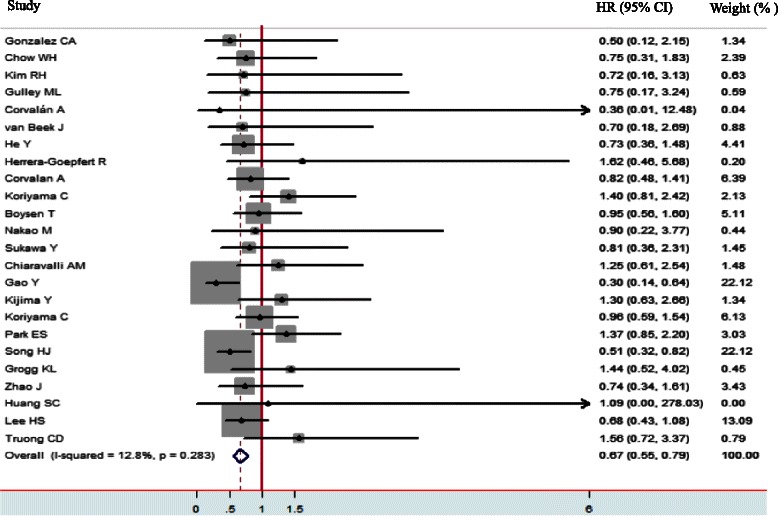
Fig. 2.

The forest plot demonstrates the effect sizes and 95 % confidence intervals (CIs) for each study and overall. Hazard ratios (HRs) with corresponding 95 % CIs of individual studies and pooled data for the association between Epstein-Barr virus-positive gastric cancer and overall survival. The forest plot demonstrates the effect sizes and 95 % CIs for each study and overall
