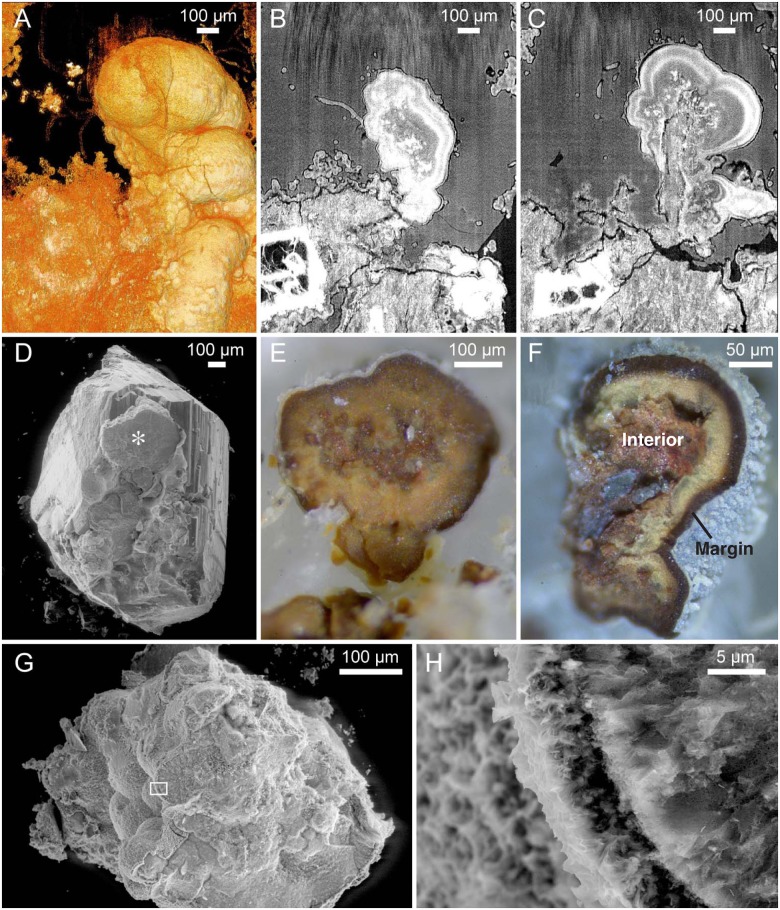
Fig 2. Microstromatolites.
(A) Tomographic volume rendering of a multiple microstromatolite at the basalt-vesicle interface (SMNH X5333). (B,C) Tomographic slices of the microstromatolite in A at different levels. The internal structure is characterized by parallel layers in a stromatolitic pattern, and brighter bands towards the margins indicating higher densities. Note how the microstromatolite and surrounding basalt are overgrown by the biofilm and how hyphae protrude. (D) ESEM image of a zeolite crystal (SMNH X5334). A large incorporated microstromatolite is marked with an asterisk. (E) Microphotograph of the marked microstromatolite in D showing a cross section of the internal organization with marginal bands. (F) Microphotograph showing the internal structure of another microstromatolite (SMNH X5335) including layering and the dark marginal band that corresponds to the bright marginal band in SRXTM (compare with B and C). (G) ESEM image of a basalt sample with microstromatolites (SMNH X5336). Frame marks position of H. (H) Close-up of G showing the marginal band.

