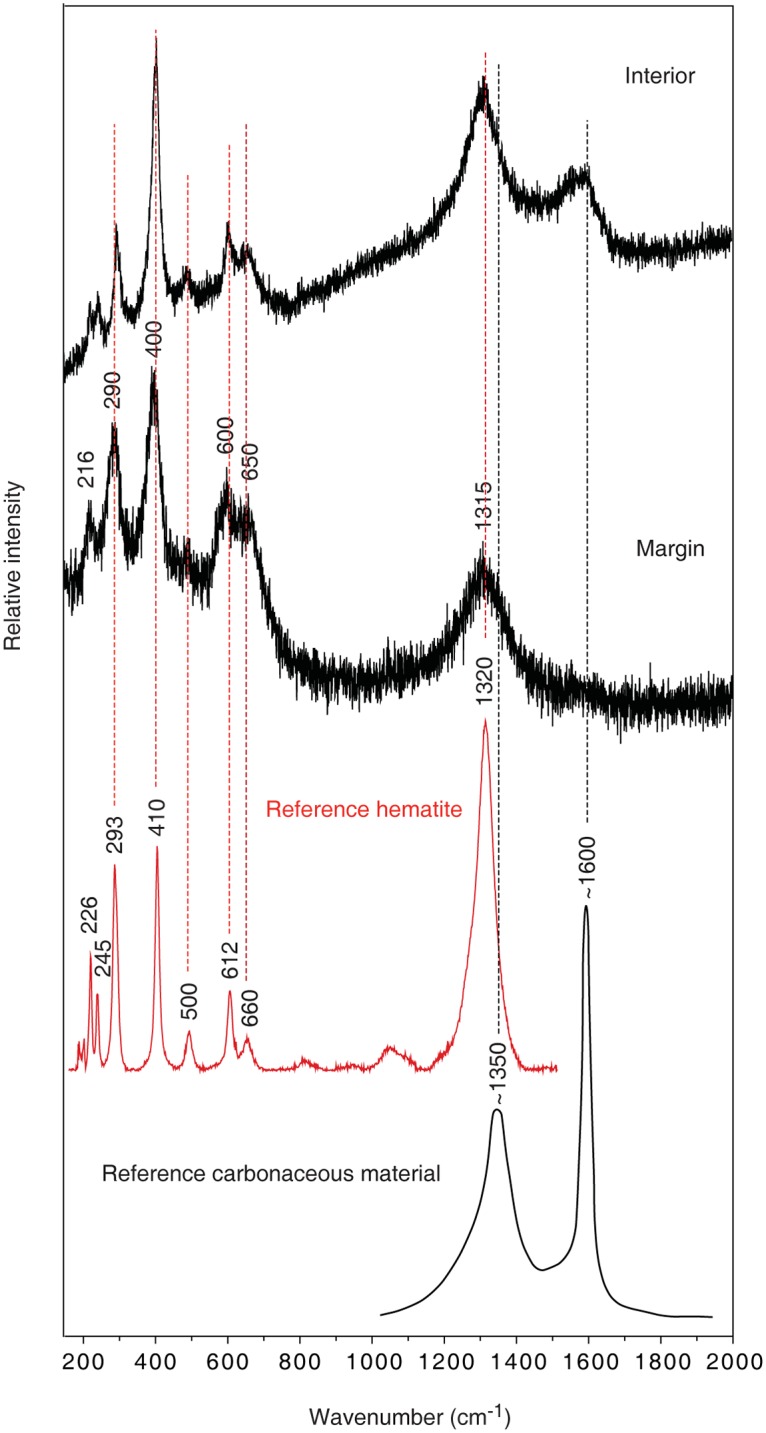
Fig 3. Raman spectra of the microstromatolites.

Raman spectra in the spectral range 150–2000 cm-1 of the interior and the margin of a microstromatolite (SMNH X5335), shown in 2F. The spectrum from the margin shows bands that are attributed to hematite; a similar spectrum is obtained from the interior but with an additional band around 1600 cm-1 that indicates the presence of carbonaceous material. Reference spectra of hematite and carbonaceous material have been incorporated in the figure.
