
Fig. 5.
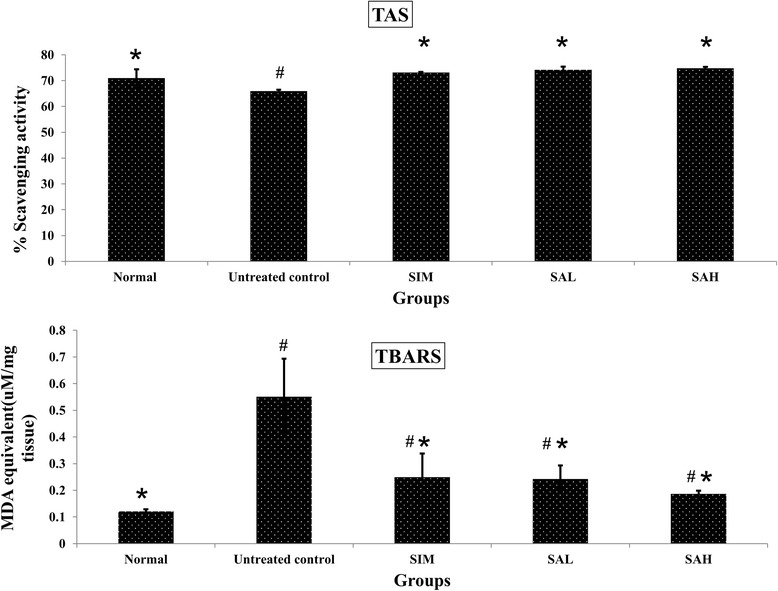
Oxidative stress markers (serum TAS:total antioxidant status; liver TBARS:thiobarbituric acid reactive species) in high fat diet-fed rats after 12 weeks of intervention. Groups are the same as Table 1. *indicates statistical difference in comparison with the untreated (high fat diet) group (p < 0.05) in each panel. #indicates statistically significant difference in comparison with the normal group (p < 0.05) in each panel