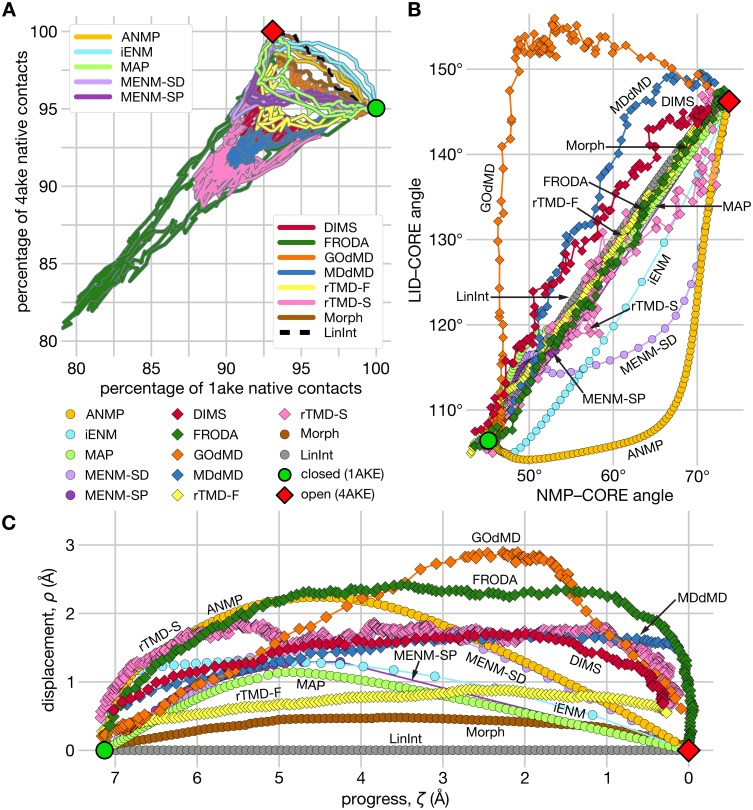
Fig 7. Projections of trajectory 2 of the AdK closed → open transition from each path-sampling method onto low-dimensional collective variables.
The location of the initial structure is shown in each plot by the green circle, while the final structure is represented by the red diamond. (A) Projection of all pathways from the various path-sampling methods onto NC space. The horizontal axis corresponds to the percentage of contacts (of a transition snapshot) shared with the initial 1AKE:A structure (green circle) and the percentage of contacts in common with the final 4AKE:A structure (red diamond) is displayed on the vertical axis. The top-left legend identifies EN-based methods; the other methods are listed in the bottom legend. The LinInt path is shown for reference as a broken black curve. (B) Projection on NMP angle (θNMP) vs LID angle (θLID). In B and C, trajectories generated by the dynamical methods (DIMS, rTMD, FRODA, MDdMD, GOdMD) are plotted with diamonds and non-dynamical method trajectories with circles. (C) ζ-ρ space projection using LinInt as the reference path. Trajectory progress in ζ-ρ space is from left to right from higher to lower values of the progress variable ζ. MDdMD terminates at 1.5 Å Cα rmsd from 4AKE (red diamond); DIMS MD terminates at 0.5 Å heavy atom rmsd.

