Fig. 1.

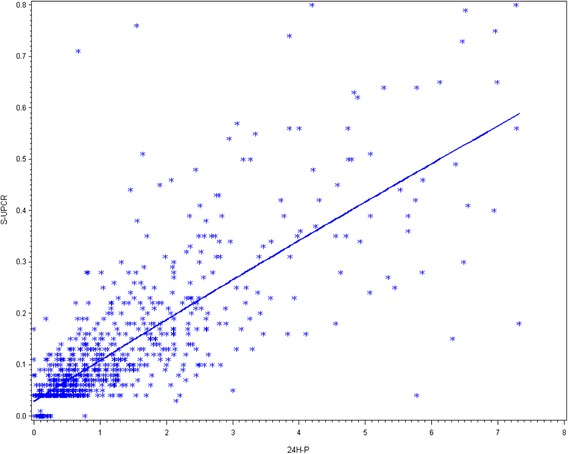
Scatterplot of correlation between protein content in a 24-h urine collection sample; (24hP) and untimed sample of urine protein/creatinine ratio for all urine samples. PCR spot urine protein/creatinine ratio

Scatterplot of correlation between protein content in a 24-h urine collection sample; (24hP) and untimed sample of urine protein/creatinine ratio for all urine samples. PCR spot urine protein/creatinine ratio