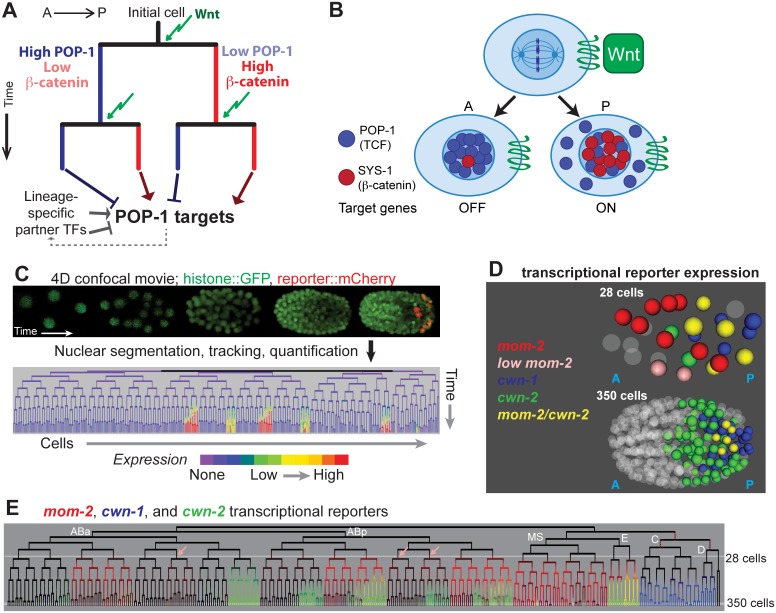
Fig 1. Wnt signaling and sources of Wnt ligand in the early C. elegans embryo.
A) Existing model for Wnt-mediated expression. Wnt (green arrow) induces posterior daughters to have high nuclear beta-catenin (red) and low nuclear POP-1 (blue), and the converse in anterior daughters. This results in activation of POP-1 targets in posterior daughters and repression in anterior daughters. The process is repeated in each subsequent division. Since POP-1 targets differ between cells, other factors, possibly themselves POP-1 targets, must provide context information. B) Stoichiometry model of POP-1/SYS-1 target expression regulation. Wnt ligand orients the division axis of a cell and generates an anterior daughter with high nuclear POP-1 and low SYS-1 and a posterior daughter with high nuclear SYS-1 and low POP-1. C) In automated lineage tracing, movies of embryos expressing fluorescent histones (Pnob-1 shown) is processed by StarryNite cell tracking software [47, 80] to produce a lineage tree with expression quantified at each time point. D) Location of the nuclei expressing the 3 earliest Wnt ligands at the 28 and 350 cell stages. E) Transcriptional reporter expression of the earliest three Wnt ligands: mom-2 (red), cwn-1 (blue) and cwn-2 (green). Lineages expressing low levels of mom-2 are marked with pink arrows. Outside of the E lineage, there is little overlap (yellow) suggesting mom-2 expression is down-regulated as cwn-2 is activated in co-expressing lineages. Known maternal expression of mom-2 is indicated by red dotted lines [25].

