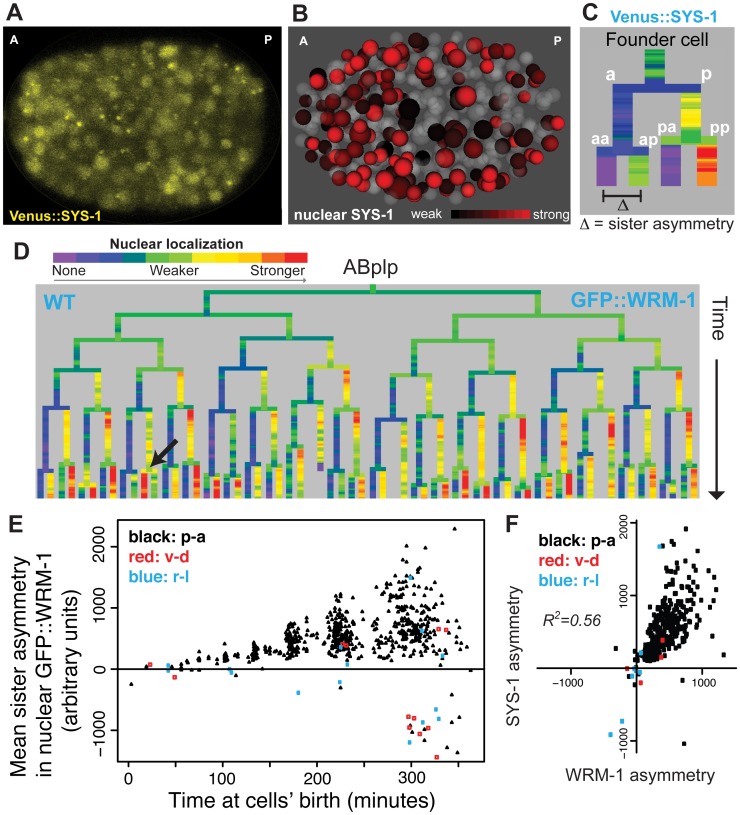
Fig 2. Nuclear localization of β-catenins is asymmetric across most embryonic cells.
A) Confocal image of Venus::SYS-1 in a 350 cell stage embryo. B) Quantification of nuclear localization for Venus::SYS-1 shows that cells with strong nuclear localization of β-catenin (red) are distributed across the A-P axis. Grey cells have little to no detectable nuclear Venus::SYS-1. C) Overview of naming rules. Posterior daughter cells are represented as right branches on lineage trees. Sister asymmetry is measured by subtracting expression between daughter cells. D) Mean nuclear GFP::WRM-1 levels across the ABplp lineage. Branch color represents nuclear fluorescence intensity on a scale from purple (weak nuclear depletion) to green (weak nuclear enrichment) to red (strong nuclear enrichment). Note stronger enrichment in posterior daughters of later divisions and rare divisions with reversed polarity (black arrow). E) Mean sister asymmetry in nuclear GFP::WRM-1 for each division assayed through bean stage (~600 cells). Colors denote orientation of division according to Sulston. F) Correlation between mean GFP::WRM-1 and Venus::SYS-1 asymmetry for each division through the 350-cell stage.

