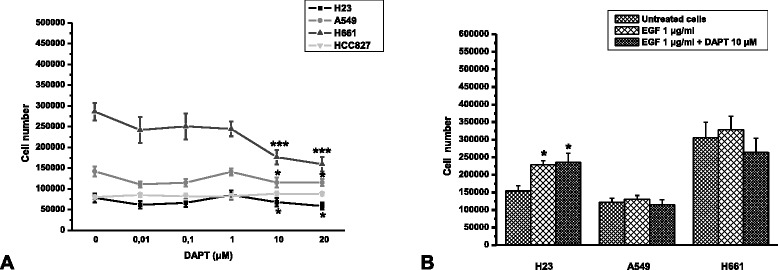
Fig. 2.

The effect of DAPT a) alone and b) after stimulation of NSCLC cells with EGF in cell proliferation, 48 h after DAPT application. Each value represents the means ± SEM from at least three independent experiments. The asterisks denote statistically significant difference between experimental groups and untreated cells. C *P < 0,05 and ***P < 0,0001
