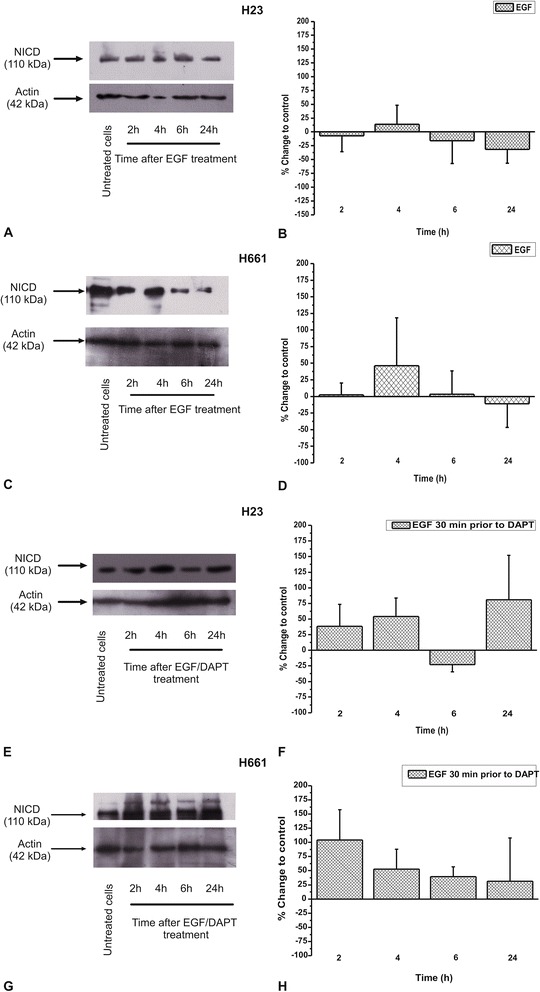
Fig. 4.

The EGF effect on NICD protein levels, alone in a) H23 and c) H661 cells or prior to DAPT in e) H23 and g) H661 cells in a time dependent manner. The images are representative of three independent experiments. Western blots were semi-quantified using appropriate software. The results in b), d), f) and h) are expressed as % change ± SEM compared to untreated cells from at least three independent experiments
