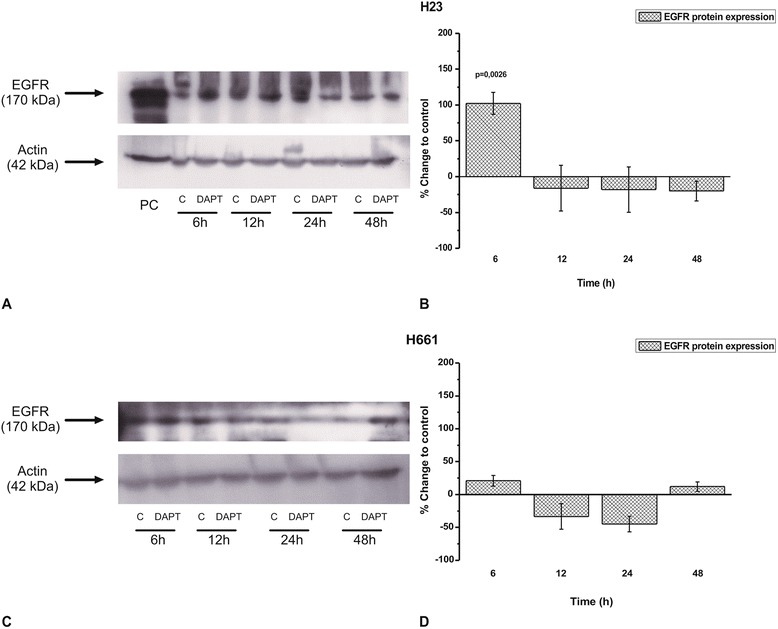
Fig. 5.

The effect of DAPT in EGFR protein levels in several time points in a) H23 and c) H661 cells. The images are representative of three independent experiments. Western blots were semi-quantified using appropriate software. The results in b) and d) are expressed as % change ± SEM compared to untreated cells from at least three independent experiments
