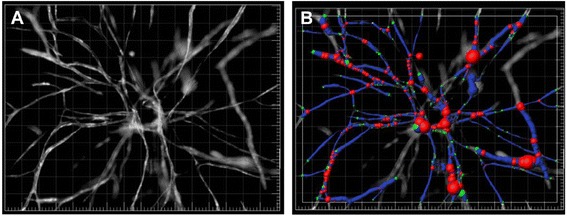
Fig. 1.

Example of how BMSCs support EC network formation in a fibrin matrix. a Fluorescent image of a capillary network on day 7. Thresholds were set before applying the Angiogenesis Tube Formation Application Module in Metamorph imaging software. b To visualize networks, the filament tracing function was used using Imaris. ECs are depicted in blue and BMSCs in red [39]
