
Fig 2. Metagenomic analysis of endpoint populations illustrated the diversity of mutations in the adapting populations.
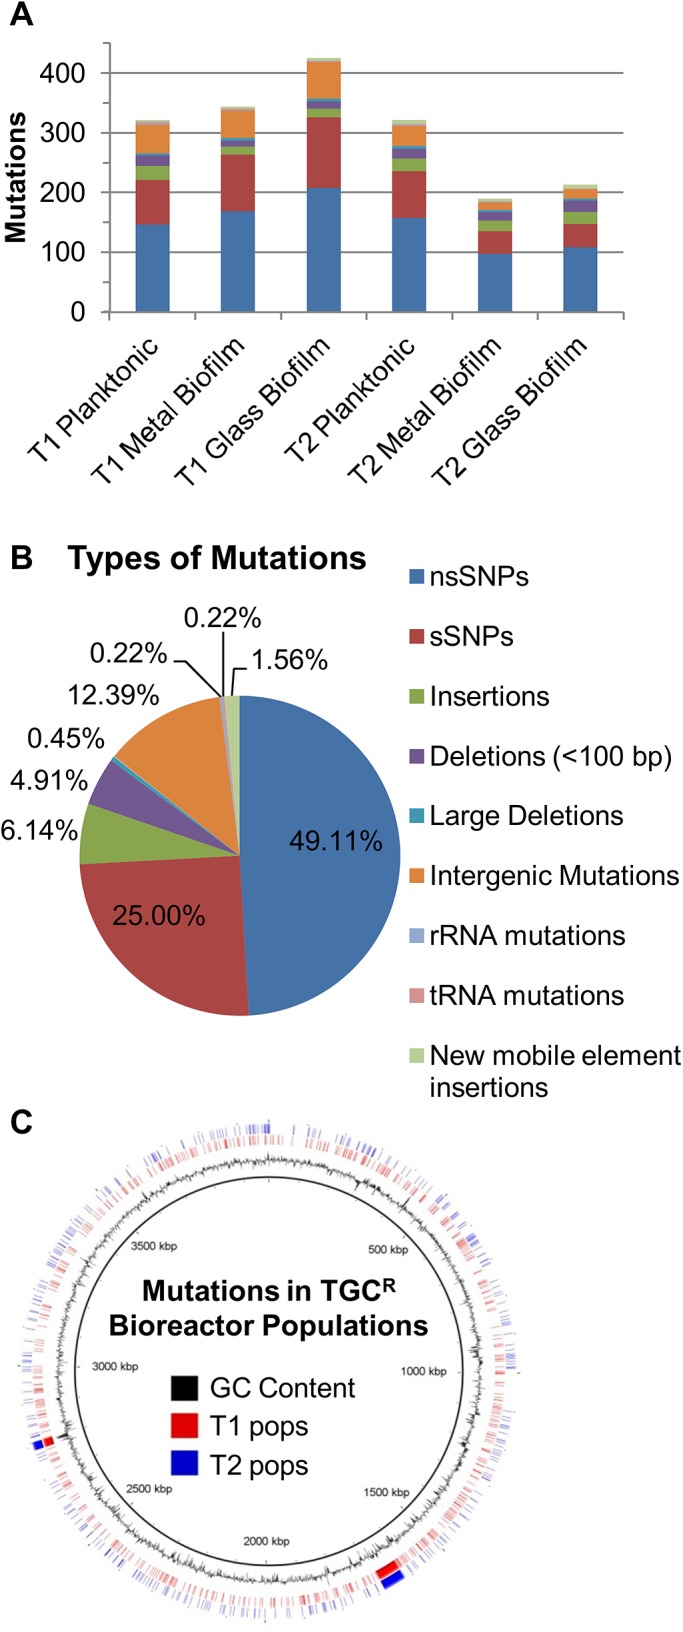
Mutations with a frequency ≥5% isolated from different locations and trials of the bioreactor are shown: (A) the number of mutations for each spatial sample; and (B) total frequency and types of mutations across all populations. (C) Lines indicate locations of the mutations in the AB210M genome (Trial 1, red; Trial 2, blue).