
Fig 3. Parallel evolution of endpoint populations was observed from Trials 1 and 2.
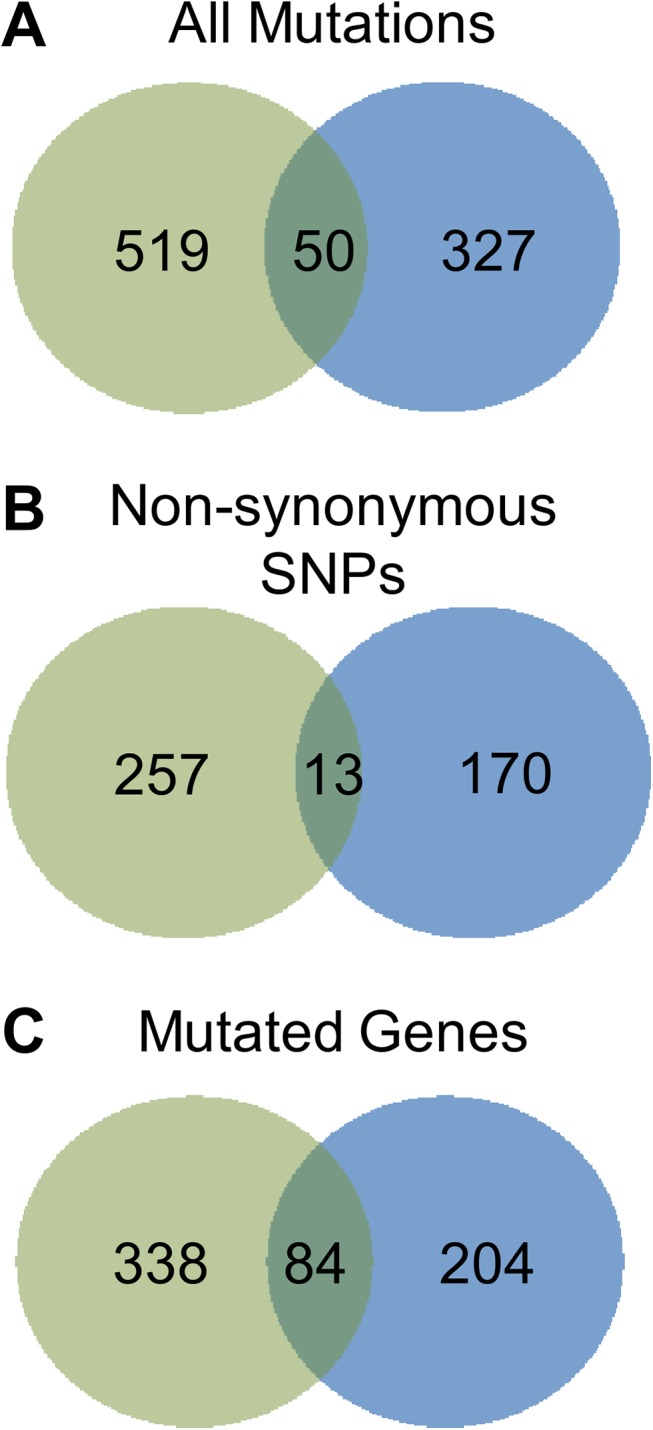
Venn diagrams represent the number of (A) all mutations, (B) nsSNPs, or (C) genes that were observed in the individual trials (Trial 1, green; Trial 2, blue).
Official websites use .gov
A
.gov website belongs to an official
government organization in the United States.
Secure .gov websites use HTTPS
A lock (
) or https:// means you've safely
connected to the .gov website. Share sensitive
information only on official, secure websites.
Venn diagrams represent the number of (A) all mutations, (B) nsSNPs, or (C) genes that were observed in the individual trials (Trial 1, green; Trial 2, blue).