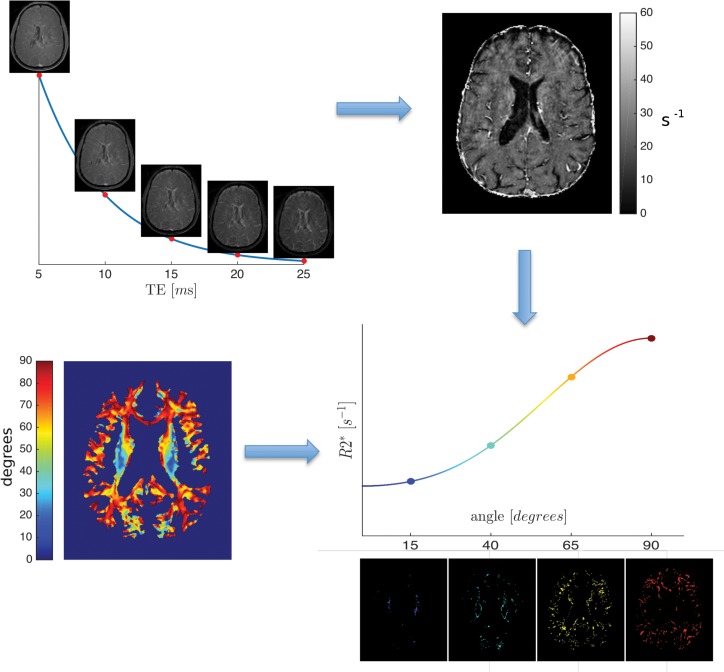
Fig 1. Data processing workflow.
From multi echo gradient echo data, an R2* map is computed. The angle between the largest eigenvector of the diffusion tensor and B0 is computed in each voxel. The R2* values from each orientation interval are pooled together, averaged and then plotted against the corresponding orientation. The four exemplary images below the R2* curve represent four angle intervals (10–15, 35–40, 60–65, and 85–90 degrees, respectively) and show which voxels contribute to the R2* average. Their color corresponds to the color of the angle map.

