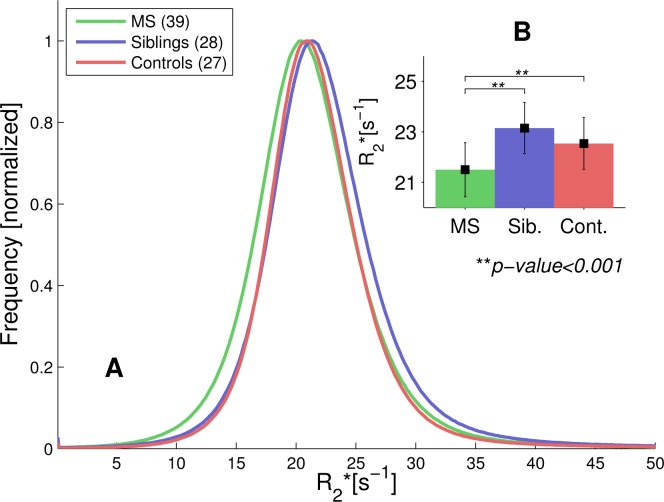
Fig 2. R2* values within the whole WM.
(A) Normalized R2* histograms across the entire non-lesional WM in all three cohorts. The histograms for controls and siblings have a large overlap, the MS group's histogram, on the other hand, is shifted towards lower R2* values. (B) The insert shows average R2* values and standard deviations of the respective groups. The R2* average was significantly reduced in the MS cohort (p < 0.001), but no difference was observed between controls and siblings.

