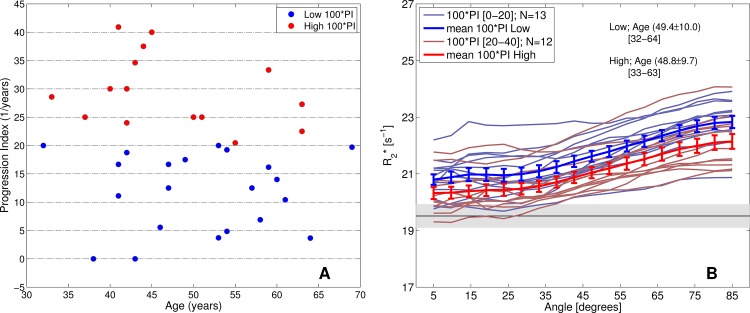
Fig 5. Progression index.
Progression index for all participants of the MS cohort, calculated as EDSS/DD (DD = disease duration). (A) Low and high PI values were separated based on a cut-off at 100*PI = 20. (B) Age-matched patients were divided in high 100*PI (>20) and low 100*PI (<20). Note that R2* values in the low PI group are higher than in the high PI group, supporting the hypothesis of a decrease in R2* with disease progression.

