
Fig. 4.
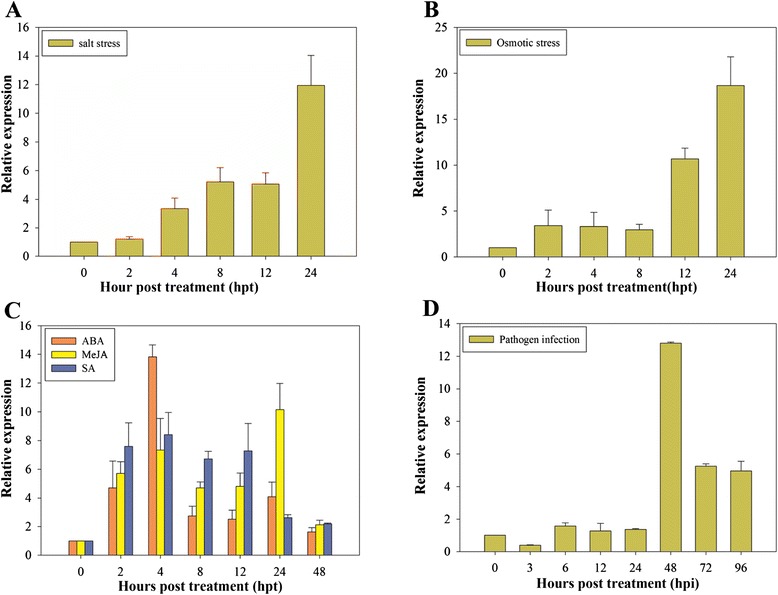
CaPAO expression patterns in pepper leaves treated with various stresses. a Salt stress; b osmotic stress; c phytohormone treatments (including ABA, MeJA and SA); d P. capsici infection. The relative transcriptional expression of CaPAO was calculated in various treated leaves in comparison to that in the mock controls across time points. Error bars represent SD for three independent replicates