
Fig. 8.
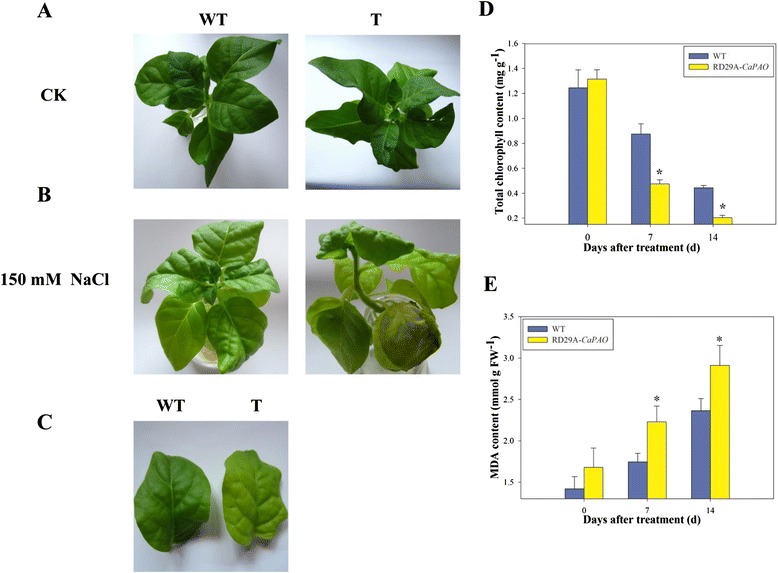
Phenotypes (a, b, c), chlorophyll contents (d) and MDA contents (e) of transgenic tobacco plants after salt treatment under 150 mM NaCl. a Phenotypes of wild type and transgenic plants before salt stress, b phenotypes of wild type and transgenic plants after salt treatment for 7 d, c phenotypes of leaves of wild type and transgenic plants after salt treatment for 7 d, d chlorophyll contents and e MDA contents of transgenic and wild-type tobacco plants under salt stress for 7 and 14 d, respectively. Error bars represent SD for three biological replicates. Asterisks indicate a significant difference (p < 0.05) compared to wild type leaves