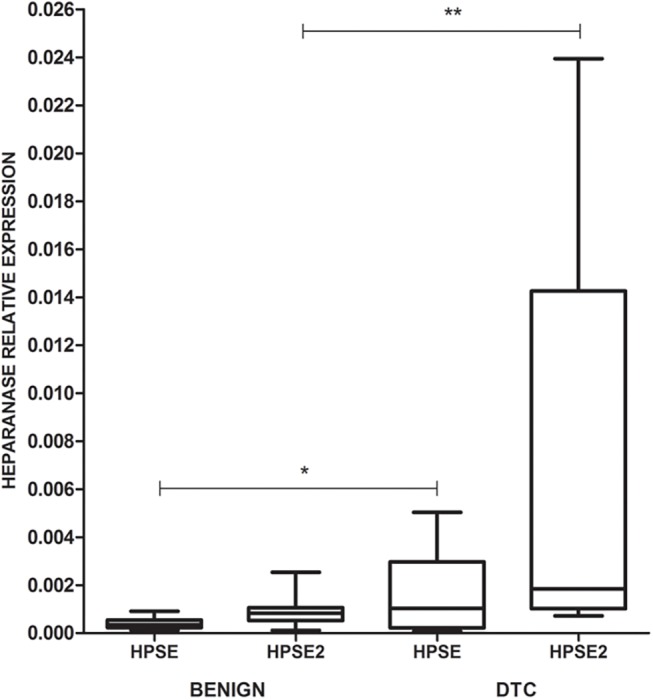
Fig 2. HPSE and HPSE2 quantitative RT-PCR analysis.

The values are represented by box plots and demonstrate the high expression of HPSE2 in DTC (**P = 0.001, Mann-Whitney test) and also of HPSE but with just a statistical trend (*P = 0.067, Mann-Whitney test); (N = 27).
