
Fig. 5.
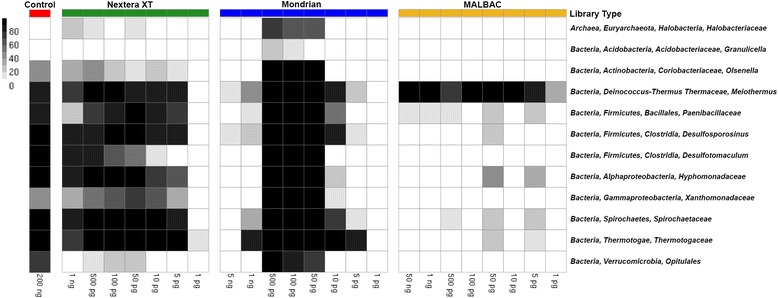
Heatmap noting the completeness of genomic bins extracted from each of the low input metagenomes. The color bar on top of the figure refers to each of the three tested library types and control library (Control = red, Nextera XT = green, Mondrian = blue and MALBAC = yellow). Samples are also arranged where the highest input quantity is located on the left side of each library type