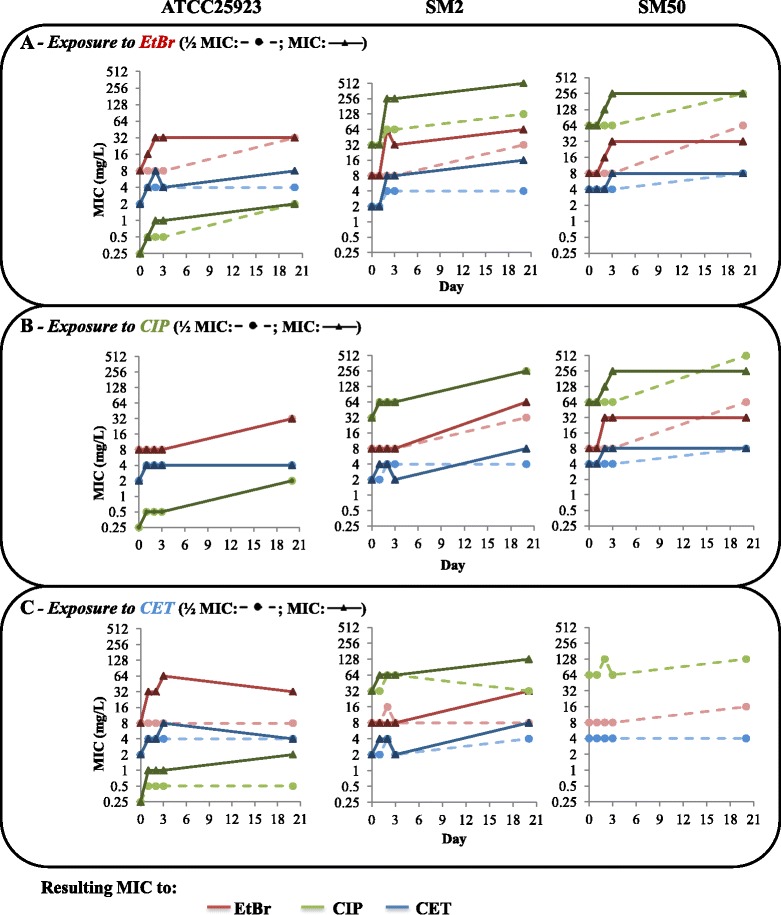
Fig. 1.

Evolution of MIC values (mg/L) of the EP substrates for the strains in study. The data presented correspond to the MICs of ethidium bromide (EtBr, red), ciprofloxacin (CIP, green) and cetrimide (CET, blue) throughout the 20-day exposure to EtBr (a), CIP (b) and CET (c) at half MIC (dotted lines) or at the MIC (full lines) (data available for days 0, 1, 2, 3 and 20th). No growth was obtained for strain SM50 at the CET concentration corresponding to the MIC
