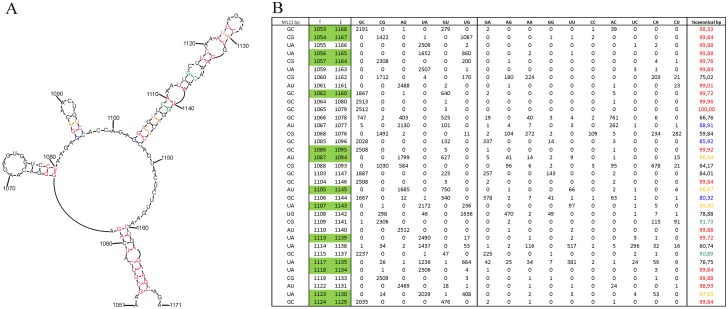
Fig 1. Secondary structure of M121 predicted by RNAalifold and bioinformatics calculations for possibility of each base pair.
A. Base pairs in secondary structure are colored according to % of canonical base pairs calculated for type A influenza (last column of table): red >98%; 95 ≤ orange < 98%; 90 ≤ green < 95%; 85 ≤ blue < 90%. B. In table are marked preserving mutations: indicated by green shadow are evidence of compensatory mutation.

