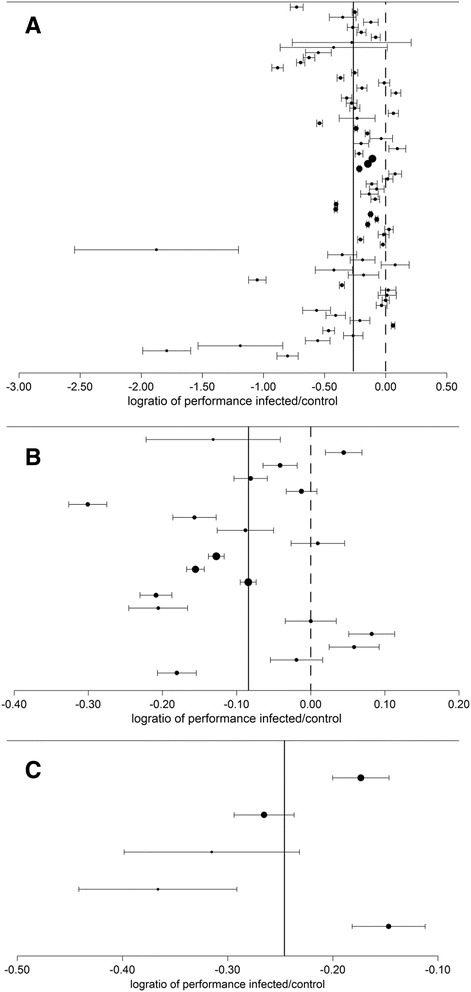
Fig. 1.

Forest plots of 94 trials included in the meta-analysis of impact of gastro-intestinal nematode infection on weight gain (a, n = 70), wool production (b, n = 19) and milk yield (c, n = 5) in sheep. Black dots represent the log-transformed ratio of performance of the infected over the control group in each trial. Dot sizes are proportional to the sample sizes in the trial and horizontal bars give the standard error of the estimate. Vertical dotted lines indicate the zero (no effect of nematode infection on production) and vertical continuous lines show the overall estimate for all the trials in each performance trait
