Fig. 10.

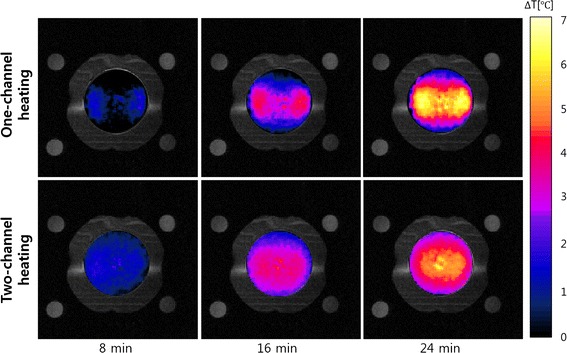
The experimental temperature maps at the time of 8, 16, and 24 min RF heating. The top and bottom rows are the temperature maps for the one-channel and two-channel RF heating cases, respectively

The experimental temperature maps at the time of 8, 16, and 24 min RF heating. The top and bottom rows are the temperature maps for the one-channel and two-channel RF heating cases, respectively