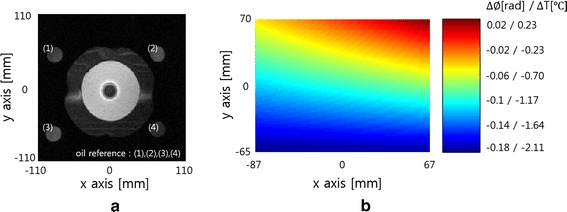
Fig. 9.

An axial-view image of the phantom and oil tubes and the Bo-drift-induced phase map. a An axial-view MR image of the phantom and four oil tubes. b The Bo-drift-induced phase map computed by applying bilinear interpolation to the phases at the oil tube position, which demonstrates possible temperature errors ranging from −2.11 to 0.23 °C if not corrected
