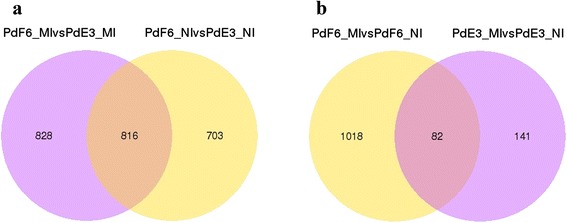
Fig. 2.

Comparisons of the number and overlapping relationships of DE genes between different samples. a Purple circle represents number of DE genes between PdF6_MI and PdE3_MI; yellow circle stand for number of DE genes between PdF6_NI and PdE3_NI. The overlapping region means shared DE genes of two comparable groups. b Purple circle represents number of DE genes between PdF6_MI and PdF6_NI; yellow circle stand for number of DE genes between PdE3_MI and PdE3_NI. The overlapping region means shared DE genes of two comparable groups
