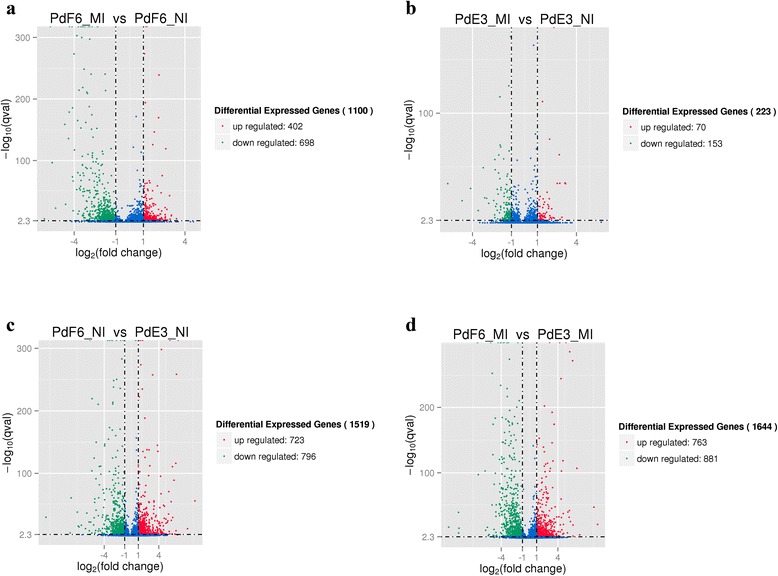
Fig. 3.

The overall distribution of DE genes in four samples. a Comparison group: PdF6_MI and PdF6_NI; b Comparison group: PdE3_MI and PdE3_NI; c Comparison group: PdF6_NI and PdE3_NI; d Comparison group: PdF6_MI and PdE3_MI. The horizontal axis shows the change of expression levels of DE genes in different samples; the vertical axis shows the statistical significance of the change of expression levels. Red dots represent genes which are up regulated and green dots means genes which are down regulated
