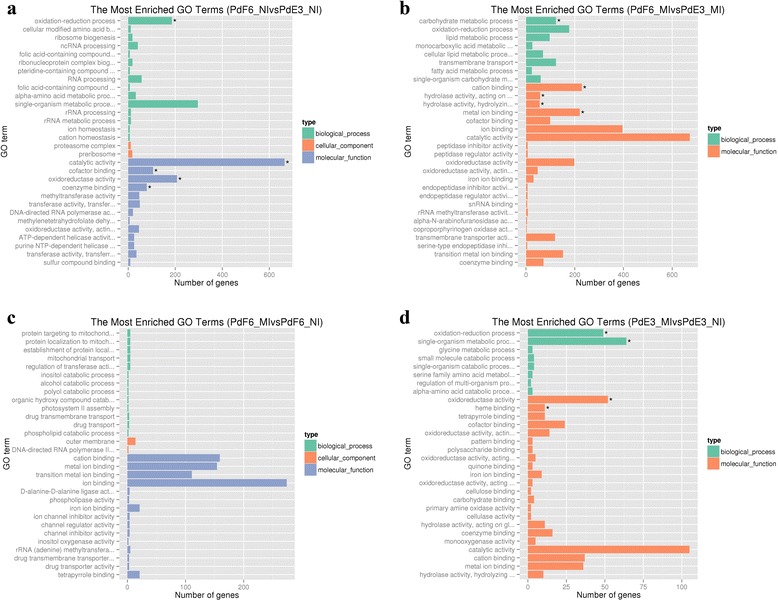
Fig. 5.

Comparing functional annotations of contigs between different samples. a Comparable group: PdF6_NI and PdE3_NI; b Comparable group: PdF6_MI and PdE3_MI; c Comparable group: PdF6_MI and PdF6_NI; d Comparable group: PdE3_MI与PdE3_NI. The green bars represent biological process; orange bars represent cellular component; purple bars represent molecular function
