Fig. 3.

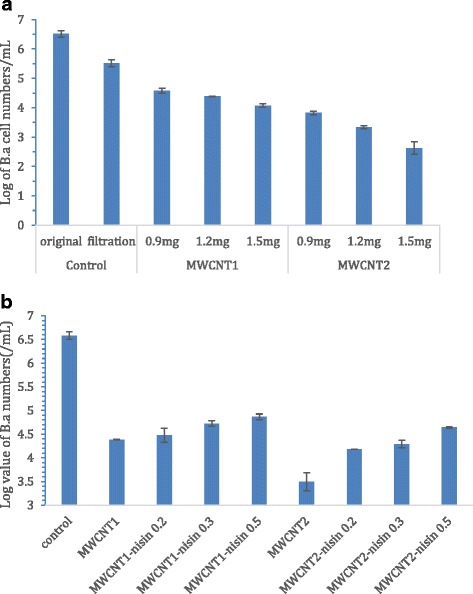
Log values of the living cells in the filtrates through the filters, including (a) the filters with 0, 0.9, 1.2, or 1.5 mg MWCNTs loading; (b) the filters with 1.2 mg MWCNT loading and 0, 0.2, 0.3, or 0.5 mg nisin loading

Log values of the living cells in the filtrates through the filters, including (a) the filters with 0, 0.9, 1.2, or 1.5 mg MWCNTs loading; (b) the filters with 1.2 mg MWCNT loading and 0, 0.2, 0.3, or 0.5 mg nisin loading