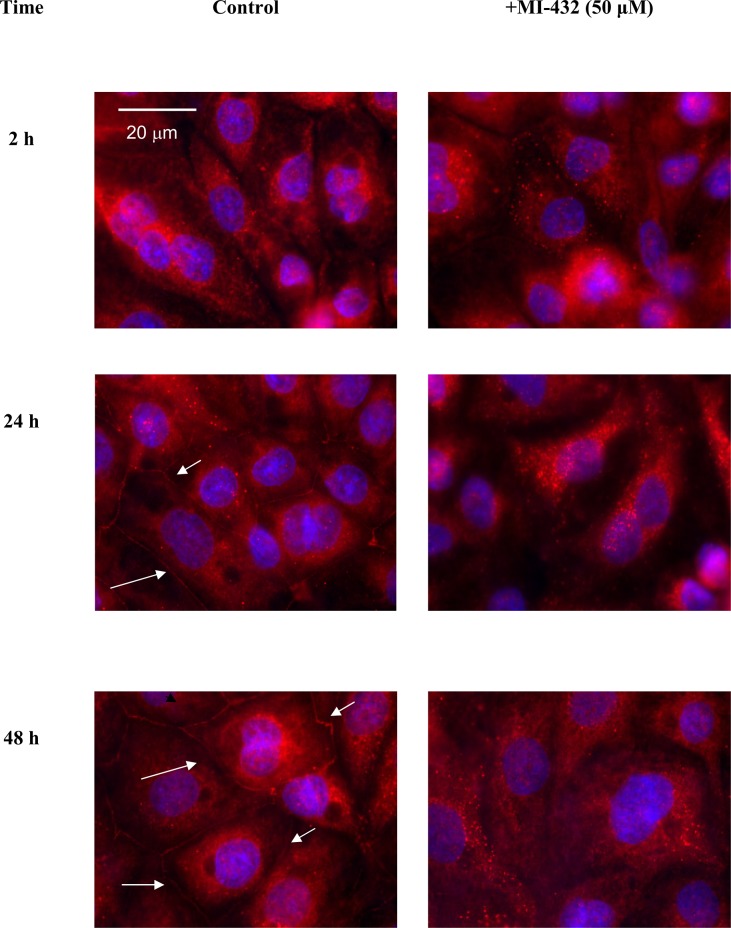
Fig 3. Immunofluorescent staining of occludin (in red) in control and in inhibitor MI-432-treated IPEC-J2 cells after different treatment times.
The cells were not completely differentiated when the inhibitor administration (50 μM) was started. Occludin can be seen in red and cell nuclei were stained with DAPI in blue. MI-432-induced matriptase suppression resulted in occludin loss in TJ strands. White arrows indicate the characteristic membranous pattern of occludin presence in the control panel.

