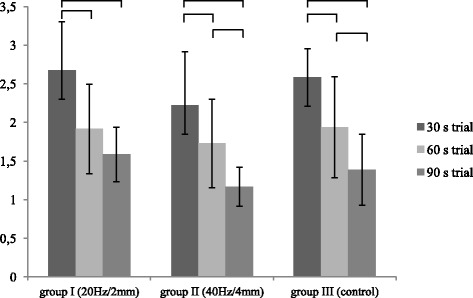
Fig. 3.

Inter-trial comparison of the normalized variability of pelvic floor muscle sEMG signal amplitude (%MVC) in the study and control groups. Horizontal bars with vertical dashes indicate statistically significant differences between duration of the trial at the same peak-to-peak displacement and frequency of vibration (p < 0.05)
