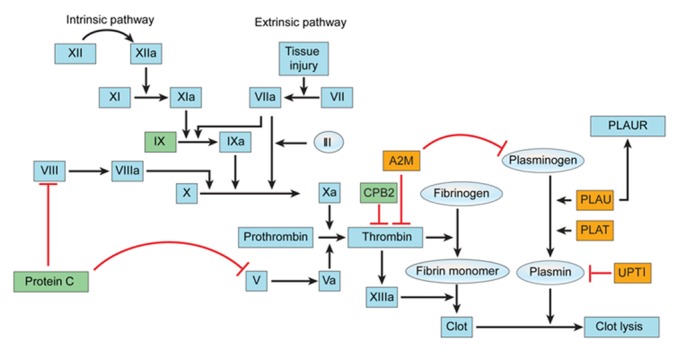
Fig 9. Genes in the coagulation cascade with altered expression levels.

Yellow boxes indicate upregulated genes (fold change ≥2 and p < 0.05). Green boxes indicate downregulated genes (fold change ≤-2 and p < 0.05). Red lines indicate inhibition.

Yellow boxes indicate upregulated genes (fold change ≥2 and p < 0.05). Green boxes indicate downregulated genes (fold change ≤-2 and p < 0.05). Red lines indicate inhibition.