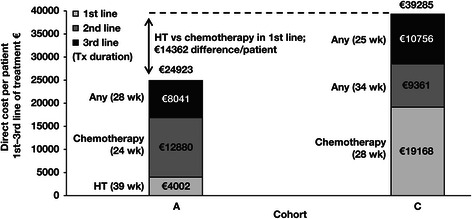
Fig. 2.

Direct overall costs by patient cohort. The costs in cohort A were significantly lower than the costs in cohort C (p < 0.001, Mann-Whitney U test). Average treatment durations by type and line of therapy in each cohort are shown in parentheses. Abbreviations: HT, hormone therapy; Tx, treatment; wk, week(s)
