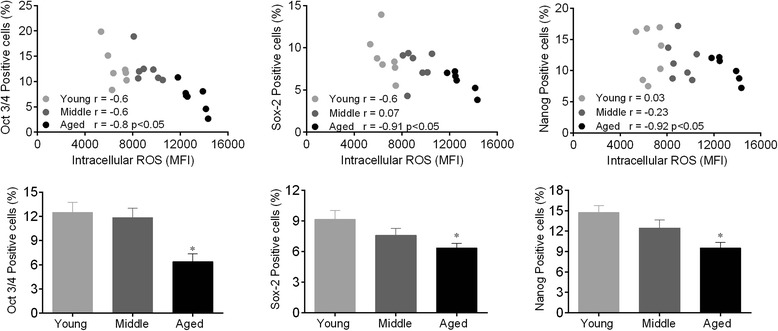
Fig. 5.

Pluripotency markers are downregulated by augmented ROS production during aging. The top panels show the correlation between intracellular ROS and ONS transcription factors. Bar graphs show the percentage of positive ONS cells. Values are the means ± SEM, *p < 0.05 vs. young. Abbreviation: Oct-3,4/Nanog/Sox-2 transcription factors (ONS)
