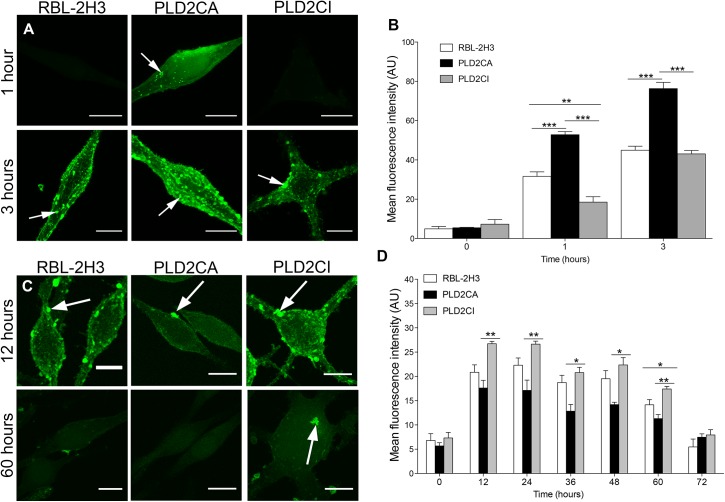
Fig 4. Trafficking of ManNAz towards the plasma membrane is regulated by PLD2.
(A) Cells were pulse-labeled for 1 h with ManNAz, washed and chased for the indicated times. After 1 h of chase only PLD2CA cells had ManNAz labeling on the plasma membrane (arrow). With 3 h of chase all cell lines had ManNAz labeling on the plasma membrane (arrows) (Bars: 10μm). (B) Quantification of ManNAz at the cell surface. In PLD2CA cells, the amount of ManNAz on the plasma membrane was higher when compared to the other cells. P<0.0001 for 1 hour and 3 hours. (C) Cells were pulse-labeled for 1 h with ManNAz, washed and chased for the indicated times. ManNAz labeled the plasma membrane (arrows) (Bars: 10μm). (D) In PLD2CI cells there was more ManNAz on the cell surface throughout the investigated periods when compared with RBL-2H3 and PLD2CA. Moreover, in PLD2CA cells, there was a decreased amount of ManNAz on the cell surface in all the chase periods. P = 0.0122 for 12 hours. P = 0.0094 for 24 hours. P = 0.0337 for 36 hours. P = 0.0278 for 48 hours. P = 0.0020 for 60 hours. For confocal microscopy, ManNAz was coupled to Alexa 488.

