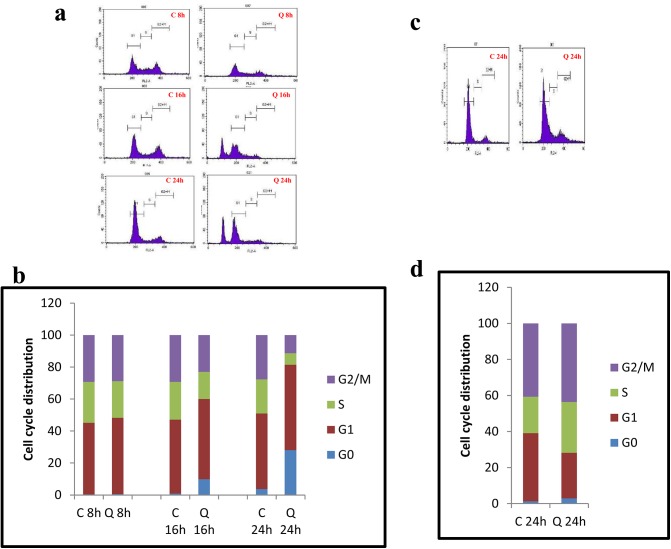
Fig 4. Flow cytometry analysis showing the effect of quercetin on cell cycle.
A. MCF-7 cells were treated with 40μM quercetin for 8h, 16h and 24h and then harvested for cell cycle analysis. The picture represents the distribution of MCF-7 cells in different phases of cell cycle. B. Bar graph represents the percentage distribution of MCF-7 cells in different phases of cell cycle. C. MDA-MB-231 cells were treated with 40μM quercetin for 24h and then harvested for cell cycle analysis. The picture represents the distribution of the cells in different phases of cell cycle. D. Bar graph represents the percentage distribution of MCF-7 cells in different phases of cell cycle. The cells were plated at a density of 1x10⁵ cells/dish and exposed to quercetin for various time periods. Cells were harvested and analysed for cell cycle. The cells with DMSO exposure served as control. The significant values represent mean ± SD of three separate experiments, each consisting of duplicate cultures.

