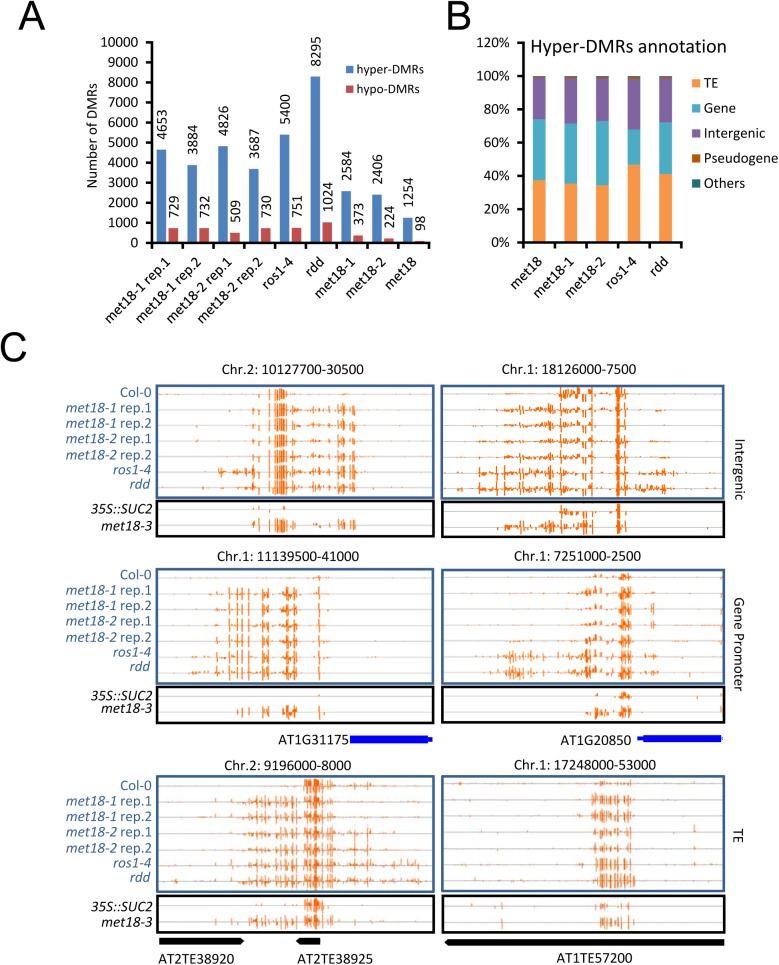
Fig 3. DNA methylation profiles in the met18, ros1-4 and rdd mutants.
A. Numbers of hyper- and hypo-DMRs identified in each mutant. met18-1 rep.1 and met18-1 rep.2 are two replications of met18-1; met18-2 rep.1 and met18-2 rep.2 are two replications of met18-2. met18-1 represents the overlap of two met18-1 replications and met18-2 represents the overlap of two met18-2 replications. met18 represents the overlap of all four samples of met18 mutants. B. Compositions of hyper-DMRs identified in different mutants. TE, DMRs in transposons but not in protein-coding genes; Gene, DMRs in protein-coding genes but not in TEs; IG, intergenic regions; Other, DMRs that overlap with other features that do not belong to TE, Gene, or IG regions. C. Snapshots of some representative DNA hypermethylation loci in met18, ros1-4, and rdd mutants. Hyper-DMRs in the intergenic regions (upper panel), gene promoter regions (middle panel), and TE regions (lower panel) are shown. Blue and black words indicate plants in Col-0 and 35S::SUC2 transgene background, respectively. The exact length and chromosome coordinates of the hyper-DMRs are listed in the S1 Table.

